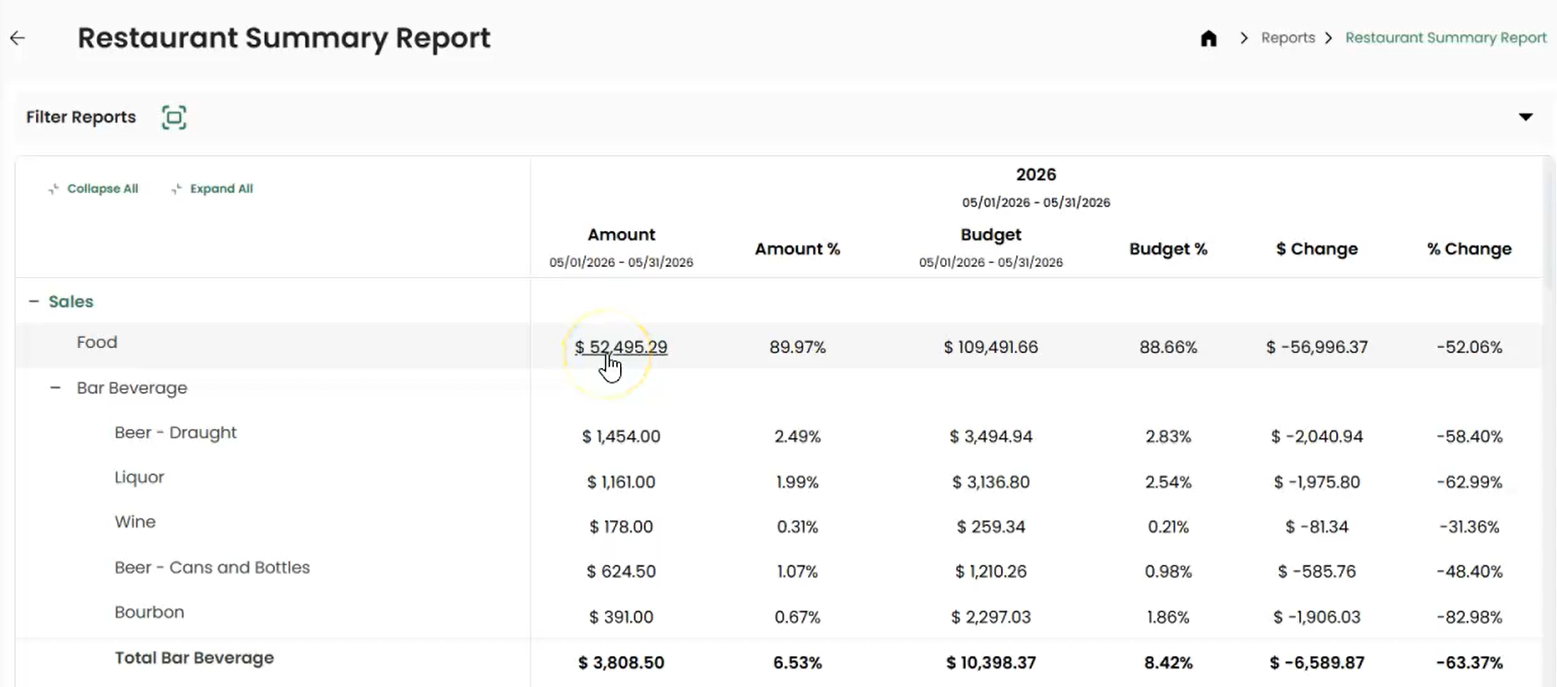
The Restaurant Summary Report is a comprehensive look at how your restaurant is doing. It's available at the top of your Reports Page here: https://app.clickbacon.com/reports/reports
Remember: every time you change any parameters to the report, be sure to click on LOAD REPORT.
You can filter your report by a specific period (i.e. Last Month) or by a custom date range.
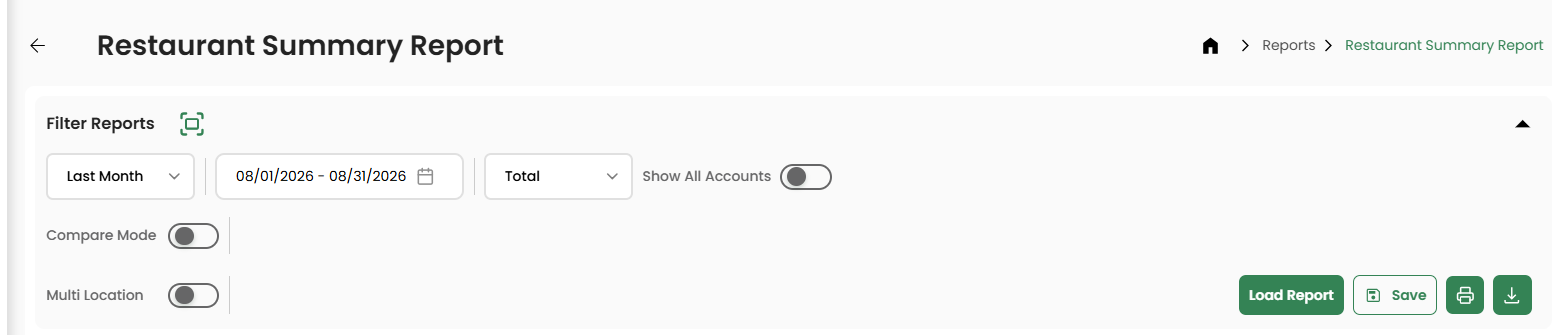
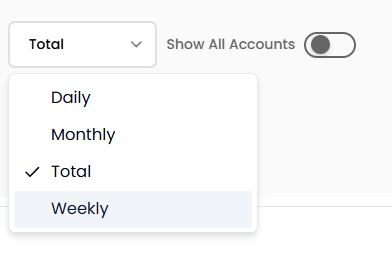
You can display your report broken down by day, month, weekly or totals. You can also opt to show all accounts, even if there is no data there.
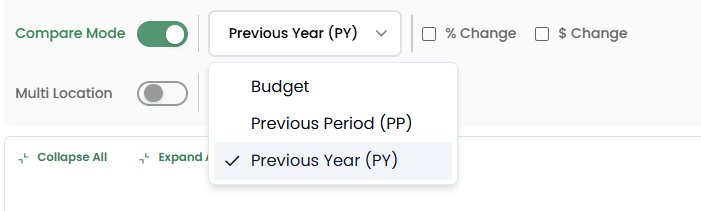
You can also turn on the Compare Mode. You can compare against your budget, the previous period or the previous year.
→ Choosing previous year will show you the exact same calendar dates from last year.
→ Choosing previous period will show you the exact same block of time previous to the one chosen.
→ Choosing budget will show you how you're performing against your budget for that period of time
You can also choose to show those changes as a percentage or dollar amount or both.
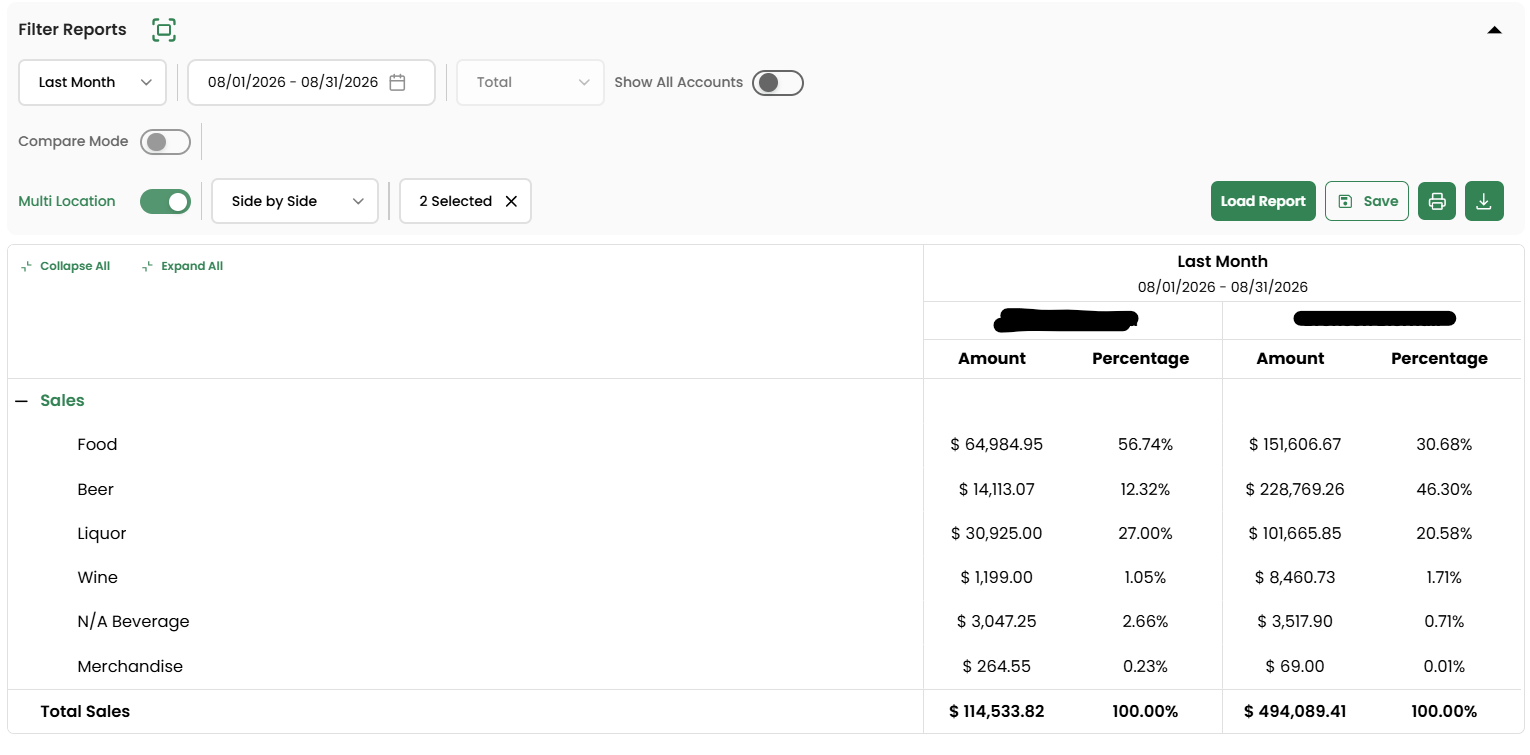
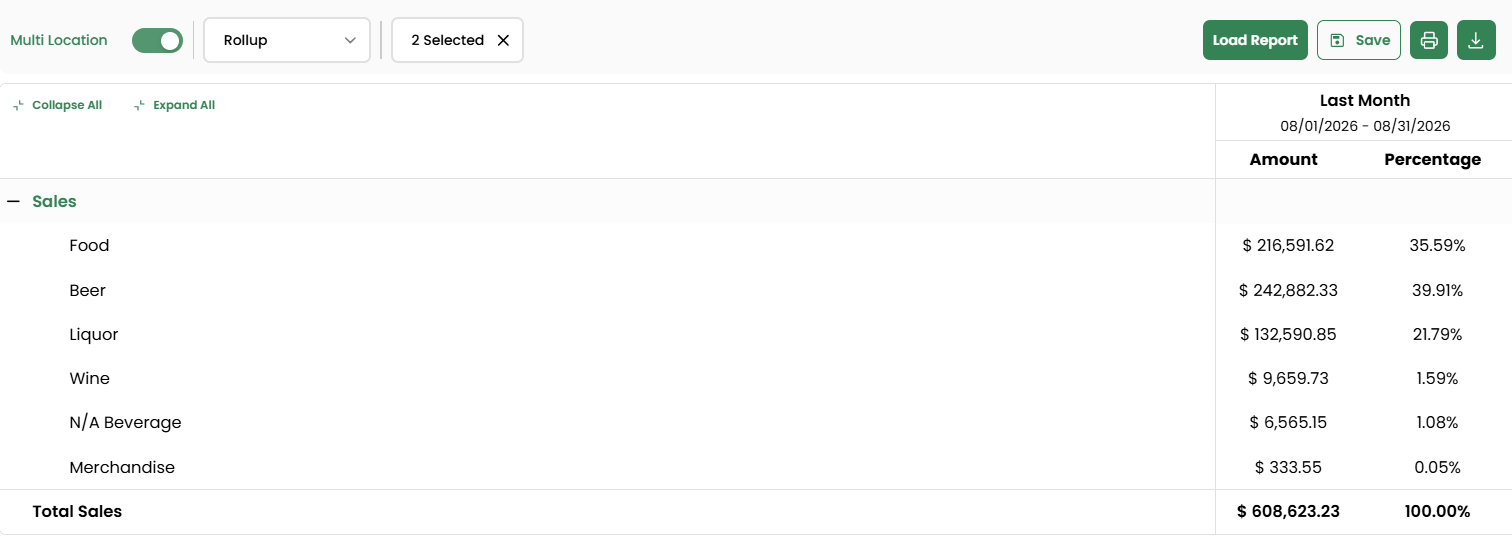
If you have multiple locations, you can toggle on the Multi Location and select which locations you'd like to view. You can choose to see the data side by side or rolled up.
How to read your budget comparison
Please watch this video for a full understanding of how to read the columns and numbers when comparing your data to budget.
The amount columns show you what you are currently doing. In the example from the video, the current food sales for the month of may was $52,495.29. The percentage of 89.97% tells us that of ALL the sales made in May, 89.97% came from food.
The budget columns will show you your budgeted amounts. In this example, $109,491.66 has been budgeted for food. The 88.66% tells us that of ALL the sales you've budgeted for that period, 88.66% is budgeted for food sales.
The $ and % change shows you the difference between the two. For food, we take your actual food sales and divide it by the budgeted food sales. Here, the negative number shows you that you are $56,996.37 under your budget for food sales.